

Charts & Visualizations in Kommon Poll
Use chart categories and controls to analyze mentions, reach, sentiment, topics, authors, domains, CTAs, images, demographics, and competitors.


Kommon Poll provides charts and visual tools for analysing mentions, reach, influence, sentiment, topics, authors, platforms, competitors, images, and more.
Main Chart Types
Mention Trend And Count Charts
These charts show how conversation volume changes over time.
Includes:
- Mention Count Chart
- Social Mention Count Chart
- Non-Social Mention Count Chart
- Mentions by Source
- Mentions by Source Over Time
- Mention Time Distribution Heatmap
Time-series charts can include aggregation controls for:
- 1D - day
- 1W - week
- 1M - month
- 1Q - quarter
- 1Y - year
Use these controls to regroup the same trend by the time period that best fits your analysis.
Influence And Reach Charts
These charts show the scale and impact of conversations.
Includes:
- Influence Score Trend
- Average Influence Score
- Social Reach Chart
- Average Social Reach
Sentiment Analysis Charts
These charts reveal tone, polarity, subjectivity, and sentiment movement.
Includes:
- Sentiment Polarity Chart
- Sentiment Subjectivity Chart
- Sentiment Subjectivity Over Time
- Sentiment Trends by Source
- Sentiment Distribution Bubble Chart
- Overall Sentiment Count Chart
Mention Analysis Charts
Mention Analysis includes several operational breakdowns:
- Mentions by Domain chart and domain table
- Post Type pie chart and details cards
- CTA Type pie chart and details cards
- Mention Time Distribution
- Author Analysis
- Emoji Analysis
- Hashtag Analysis
- Key Phrases
Use CTA Type to understand calls to action or content intent patterns found in mentions. Use Post Type to compare posts, comments, reviews, articles, or other content types depending on available data.
Topic, Keyword, Hashtag, And Emoji Charts
These charts show language, themes, and conversation signals.
Includes:
- Emoji Word Cloud
- Emoji Frequency Chart
- Hashtag Word Cloud
- Mentions by Hashtag - Count
- Mentions by Hashtag - Influence
- Hashtag Trends
- Key Phrases Word Cloud
- Keyword Trends line chart
- Named Entity Charts
Keyword Trends show how key phrases or keywords change over time. Hashtag charts can switch between mentions and influence where the metric control is available.
Author And Domain Charts
These charts identify the people and sources driving conversation.
Includes:
- Authors Pie Chart
- Selective Authors Chart
- Authors Table
- Active Domains Count
- Mentions by Domain
Tables may include platform filters and show/hide column controls where available.
Demographic Charts
These charts show available audience attributes.
Includes:
- Mention Heatmap
- Polarity Heatmap
- Country of Mention
- Sentiment by Country
- Nationalities
- Languages
- Business vs Individuals
- Population Pyramid
- Education
- Job Types
- Income
- Job Rank
Demographic availability varies by platform and data permissions.
Image Analysis
Image Analysis surfaces visual signals from collected mentions, such as image and logo-related panels where media data is available. Use it to review how visual content appears alongside your mentions.
Competitor Analysis Charts
Competitor charts compare your search with competitor searches.
Includes:
- Competitor Mention Count Trend
- Competitor Influence Score Trend
- Competitor Social Reach Trend
- Competitor Sentiment Bubble Chart
- Platform Mention Distribution
- Share of Voice
Chart Interaction Features
Chart controls vary by chart, but the common pattern includes:
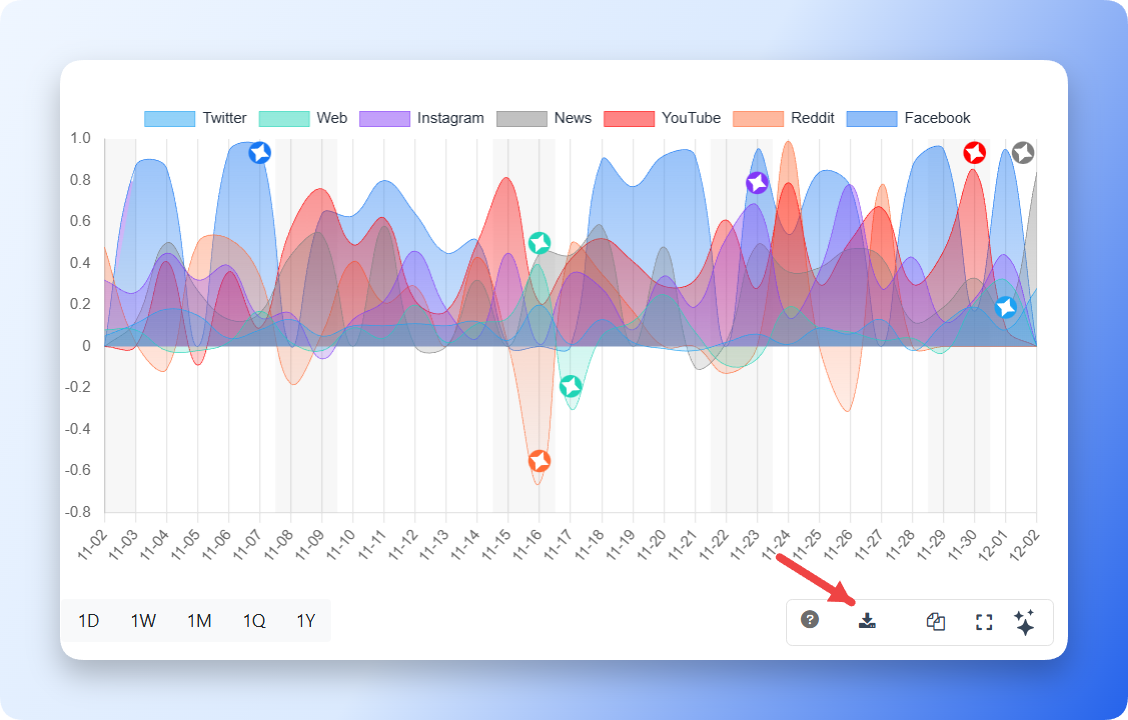
Download
Downloads the chart as an image for offline analysis, reports, or presentations.
Copy
Copies the chart to your clipboard so you can paste it into documents or slides.

Expand
Opens the chart in a larger popup view. Use this when labels, legends, or dense time-series data are easier to inspect at a larger size.
Legend Toggle
Where relevant, toggles the chart legend on or off.
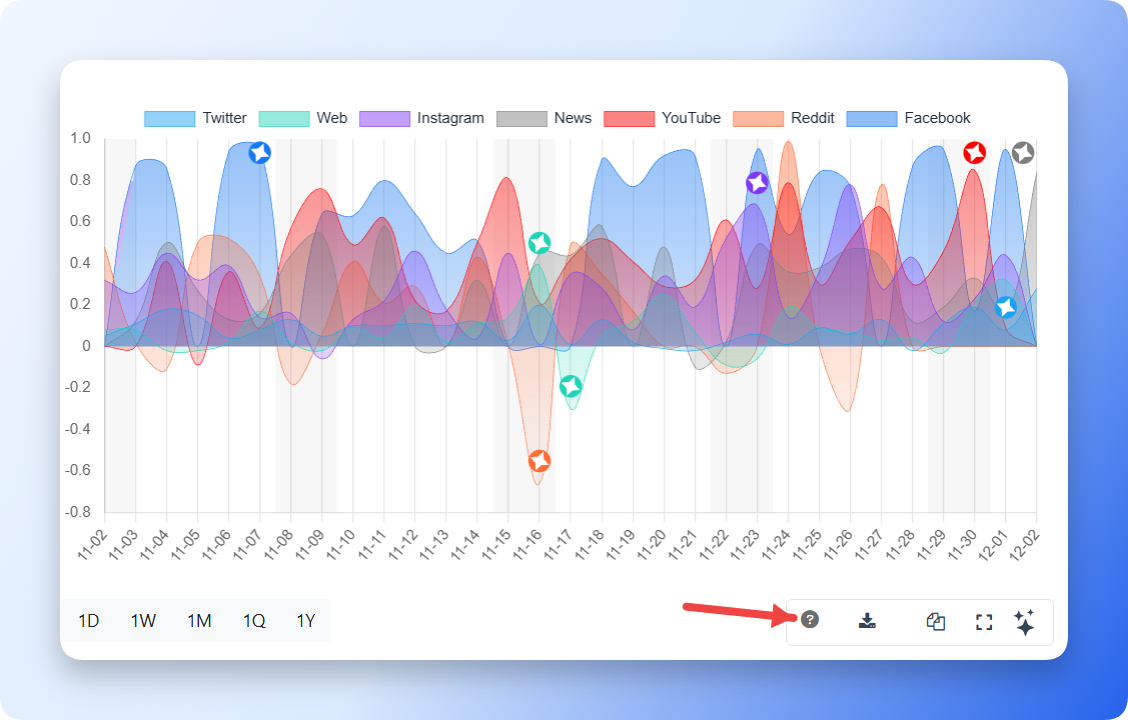
Info
Provides definitions or metric explanations for the chart.
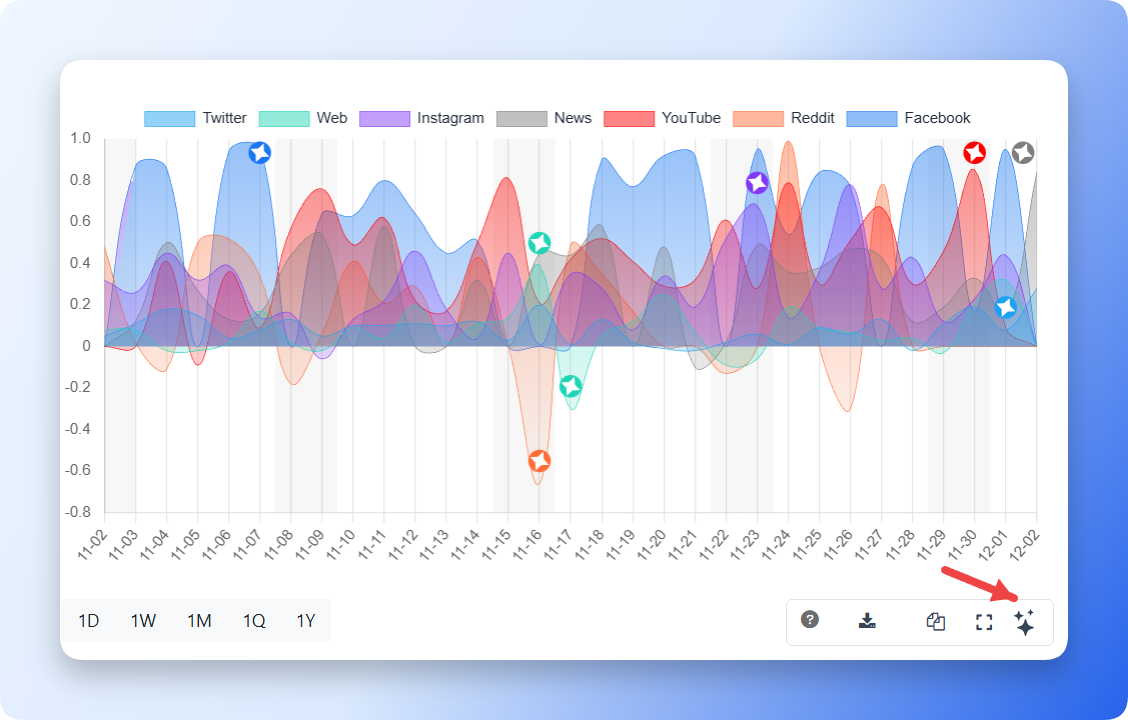
Kommon Poll AI Insight
The AI insight or sparkle button appears only on supported charts. It can summarize important dates, significant changes, and patterns, but it is not available on every chart.
Priority And Scam Analysis
Priority and scam signals appear most directly on mention cards and filters, but they also affect analysis workflows. Use priority filters and full-card exports to isolate urgent, high-risk, or scam-flagged mentions for review.
Summary
Use charts to locate spikes, compare sources, inspect sentiment, identify authors, review hashtags and keywords, evaluate CTAs and post types, analyse visuals, and benchmark competitors. Standard chart actions now include Download, Copy, Expand, legend toggles where relevant, and Kommon Poll AI insights only where enabled.