

Overview Tab Metrics
Understand the core KPI tiles, trend charts, and timeframe aggregation controls in the Overview tab.


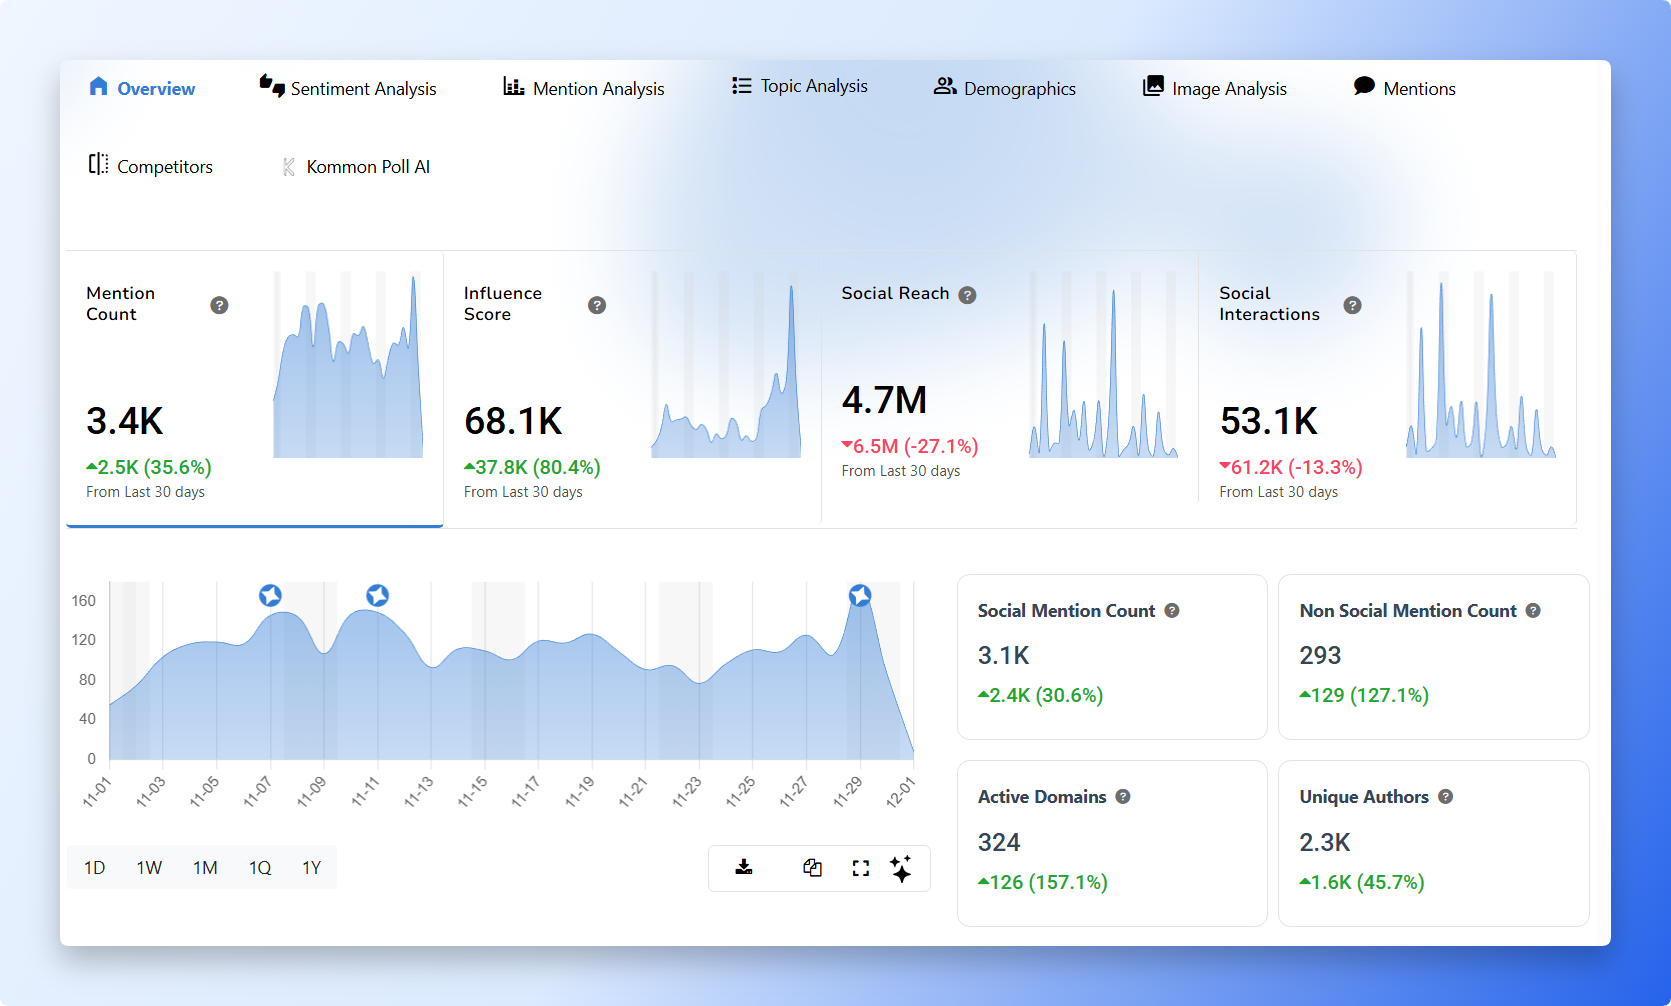
The Overview tab provides the top KPIs and trend charts for real-time monitoring.
Overview Metrics
Mention Count
Total mentions detected during the selected time period.
Influence Score
An impact score for the conversation. Higher values indicate stronger or more influential conversation sources.
Social Reach
Estimated potential audience that could have seen the collected social mentions.
Social Interactions
Total engagement on social content, including likes, comments, shares, reactions, and similar actions.
Additional Overview Insights
Social Mention Count
Mentions from social media platforms only.
Non-Social Mention Count
Mentions from blogs, news sites, forums, reviews, and other web content.
Active Domains
Unique websites contributing mentions.
Unique Authors
Distinct users, pages, accounts, or authors contributing mentions.
Trend Charts
Overview trend charts can include:
- Mention count history
- Influence history
- Reach history
- Interaction history
Time-series charts can be regrouped with timeframe controls:
- 1D - day
- 1W - week
- 1M - month
- 1Q - quarter
- 1Y - year
Chart actions can include Download, Copy, Expand, legend toggle where relevant, and Kommon Poll AI insight where enabled.
Summary
The Overview tab shows how widely your brand is being discussed, how impactful the conversation is, and how the trend is changing over time. Use timeframe controls to change the aggregation level before exporting or asking Kommon Poll AI for context.